
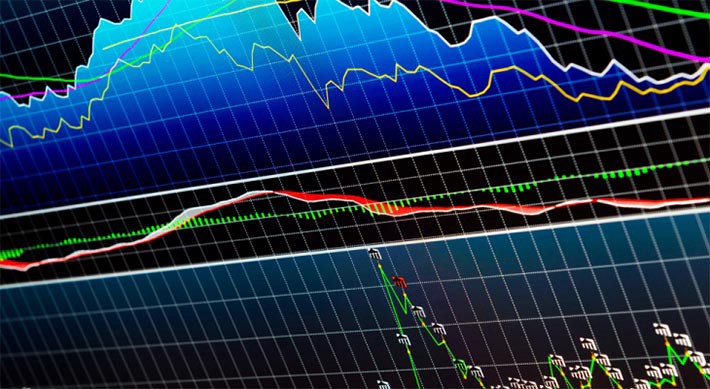
Cryptocurrency markets move fast, often reacting to news, liquidity shifts, and trader sentiment within minutes. While no tool can predict price movements with certainty, technical indicators help traders interpret market behavior and make informed decisions. Understanding how these tools work — and when to use them — can significantly improve risk management and trade timing.
Below are the essential crypto trading indicators every serious trader should understand.
Moving Averages (MA)
Moving averages smooth out price fluctuations to highlight the broader trend. Instead of reacting to every short-term spike, traders use them to identify directional bias.
Types of Moving Averages
-
Simple Moving Average (SMA): Calculates the average closing price over a specific period.
-
Exponential Moving Average (EMA): Places more weight on recent prices, reacting faster to changes.
How Traders Use Them
-
Identifying trend direction
-
Spotting crossover signals (e.g., short-term MA crossing above long-term MA)
-
Acting as dynamic support and resistance
Shorter timeframes (like 20 EMA) are popular for active traders, while longer ones (50 or 200 SMA) help identify macro trends.
Relative Strength Index (RSI)
The Relative Strength Index measures the speed and magnitude of recent price changes. It moves between 0 and 100.
Key Levels
-
Above 70: Overbought conditions
-
Below 30: Oversold conditions
However, overbought does not always mean a price will drop immediately. In strong uptrends, RSI can remain elevated for extended periods.
Advanced Usage
-
Bullish divergence: Price makes lower lows while RSI makes higher lows
-
Bearish divergence: Price makes higher highs while RSI makes lower highs
Divergences often signal weakening momentum before a potential reversal.
MACD (Moving Average Convergence Divergence)
MACD measures the relationship between two exponential moving averages. It consists of:
-
MACD line
-
Signal line
-
Histogram
Trading Signals
-
Bullish crossover: MACD line crosses above signal line
-
Bearish crossover: MACD line crosses below signal line
-
Histogram expansion: Momentum strengthening
MACD works best in trending markets and can produce false signals in sideways conditions.
Bollinger Bands
Bollinger Bands consist of:
-
Middle band (usually 20-period SMA)
-
Upper band
-
Lower band
These bands expand and contract based on market volatility.
How to Interpret Them
-
Price touching upper band → Potential overextension
-
Price touching lower band → Possible oversold level
-
Band squeeze: Indicates low volatility before a potential breakout
Traders often combine Bollinger Bands with RSI for confirmation.
Volume
Volume represents the number of coins traded during a given timeframe. It validates price action.
Why Volume Matters
-
Breakouts with high volume are more reliable
-
Low-volume moves are prone to reversals
-
Sudden volume spikes often precede volatility
Volume is not an indicator in isolation — it confirms other signals.
Fibonacci Retracement
Fibonacci retracement identifies potential support and resistance levels during pullbacks.
Common Levels
-
23.6%
-
38.2%
-
50%
-
61.8%
The 61.8% level, often called the “golden ratio,” is widely watched by traders.
Fibonacci works best when aligned with trend direction and other confluence signals.
Stochastic Oscillator
This momentum indicator compares a closing price to its price range over a set period.
Signal Areas
-
Above 80 → Overbought
-
Below 20 → Oversold
It reacts faster than RSI, making it useful for short-term trading strategies.
Average True Range (ATR)
ATR measures market volatility rather than direction.
How Traders Use ATR
-
Setting stop-loss distances
-
Identifying volatility expansion
-
Adjusting position sizing
Higher ATR values indicate greater price movement potential.
Combining Indicators for Better Accuracy
Using a single indicator often leads to false signals. Professional traders combine tools to create confluence.
Example combinations:
-
EMA + RSI for trend and momentum confirmation
-
Bollinger Bands + Volume for breakout validation
-
MACD + Fibonacci for reversal setups
The goal is not complexity but confirmation. Too many indicators can cause confusion and delayed decision-making.
Risk Management Matters More Than Indicators
Indicators assist with timing, but risk management protects capital.
Essential principles include:
-
Never risk more than 1–2% per trade
-
Use stop-loss orders
-
Avoid overleveraging
-
Stick to a predefined trading plan
Even the best indicator fails without disciplined execution.
Frequently Asked Questions (FAQ)
1. Which indicator is best for beginners in crypto trading?
Moving averages and RSI are beginner-friendly because they are simple to understand and widely supported on trading platforms.
2. Can trading indicators predict crypto prices accurately?
No indicator guarantees accuracy. They provide probabilities based on historical data, not certainty.
3. Are indicators more reliable on higher timeframes?
Higher timeframes generally produce fewer false signals because they reduce market noise.
4. Should I use different indicators for day trading and swing trading?
Yes. Short-term traders often prefer fast-reacting indicators like EMA and Stochastic, while swing traders rely on SMA, MACD, and Fibonacci levels.
5. Do indicators work in highly volatile markets?
They can, but volatility increases the chance of false breakouts. Combining indicators with volume analysis helps filter noise.
6. How many indicators should I use at once?
Most experienced traders use 2–4 complementary indicators to avoid conflicting signals.
7. Is volume more important than technical indicators?
Volume is critical for confirmation. Price movements without volume support are often unreliable.